SEO Monthly Report Template for Agencies and Marketers

A usable SEO monthly report leads with a one-paragraph BLUF, shows several KPIs with month-over-month (MoM) and year-over-year (YoY) comparisons, and closes with three prioritized next actions, each with a named owner and a due date. That structure is what separates a report that drives decisions from a dashboard screenshot nobody reads.
Here is the checklist every monthly report should cover, in order:
- BLUF paragraph: direction (up/down/flat), biggest win or issue, and the one decision you need from the reader
- 6–8 KPIs with MoM and YoY comparisons: organic sessions, impressions/CTR, keyword ranking distribution, top landing pages, organic conversion rate, revenue or pipeline attributed to organic, backlink growth, and technical health score
- Top pages: which pages drove the most traffic and conversions this month
- Conversions and revenue: tied to specific goals in GA4, not just pageviews
- Technical health flags: index coverage, Core Web Vitals, crawl errors
- Work completed: what shipped, when, and which metric it aimed to move
- 3 next actions: priority, owner, and ETA
Per SEO Monthly Report Template With KPI Notes for Agencies, templates structured around a one-paragraph summary, KPI rows, work completed, and next actions improve both decision-making and repeatability. Fill your data exports first. Write the executive summary last, after you have reconciled the numbers.
Key Takeaways
A monthly SEO report drives decisions only when it leads with a BLUF, maps KPIs to business outcomes, and closes with named next actions.
| Point | Details |
|---|---|
| Lead with the BLUF | Write the executive summary last, after data is reconciled, so it reflects the actual numbers. |
| Cover 6–8 core KPIs | Include organic sessions, impressions/CTR, ranking distribution, top pages, conversions, and technical health with MoM and YoY comparisons. |
| Automate data pulls | Use Looker Studio connectors for GA4 and GSC to eliminate manual exports and free time for analysis. |
| Include proof of work | List each task shipped, its date, and the metric it targeted — especially critical for agency-client relationships. |
| Proxiumdigital | Proxiumdigital’s SEO retainers include monthly reporting, connector setup, and a written BLUF for local service businesses in Michigan. |
Table of Contents
- Why monthly SEO reporting matters for business decisions
- What KPIs should you include in an SEO monthly report?
- How do you build a monthly SEO report step by step?
- Which tools should you pull data from?
- What report format works best for your audience?
- How do you write an executive summary that gets decisions made?
- What should you check in your monthly technical SEO audit?
- Common mistakes to avoid in monthly SEO reporting
- How Proxiumdigital builds monthly SEO reports for local service businesses
- How do you track conversions and revenue in a monthly SEO report?
- How to incorporate competitor analysis into your monthly report
- What monthly reporting actually gets right — and what most teams miss
- Proxiumdigital handles the reporting so your team can focus on strategy
- Sources
- FAQ
Why monthly SEO reporting matters for business decisions
A monthly SEO report connects organic search activity to business outcomes, giving decision-makers the data they need to approve budgets, shift resources, and validate strategy. Without it, SEO work is invisible to everyone outside the team.
Three concrete business outcomes depend on a well-structured monthly report. First, budget decisions: a report showing a significant increase in organic-attributed leads gives a marketing director the evidence to fund a content expansion. Second, resource prioritization: if Core Web Vitals scores dropped across mobile pages, the report surfaces that before it compounds into a ranking loss. Third, proof of work: agencies that document what they shipped and what moved as a result retain clients longer, because the correlation between effort and outcome is explicit rather than implied.
Two decisions that flow directly from monthly reporting: a CMO approves a content budget increase after seeing three consecutive months of organic session growth tied to new blog posts; a development team escalates a crawl error fix from “backlog” to “this sprint” after the report flags 200 newly de-indexed pages. Neither decision happens without the data in front of the right person at the right time.
What KPIs should you include in an SEO monthly report?
HubSpot’s SEO report guide recommends a core KPI set covering visibility, organic sessions, keyword ranking distribution, top landing pages, conversion metrics, and technical health indicators, with AEO/AI visibility added for modern reports. That set maps directly to business outcomes rather than vanity metrics.
| KPI | Recommended Visualization | Primary Source |
|---|---|---|
| Impressions and CTR | Trendline (MoM + YoY) | Google Search Console |
| Organic sessions | Stat card + trendline | GA4 |
| Keyword ranking distribution | Distribution table (Top 3 / 4–10 / 11–20) | Semrush or Ahrefs |
| Top organic landing pages | Ranked table by sessions + conversions | GA4 + GSC |
| Organic conversion rate | Stat card with MoM delta | GA4 (Goals / Events) |
| Revenue or pipeline from organic | Stat card | GA4 (e-commerce or CRM integration) |
| Technical health score | Single score with trend | Semrush Site Audit or Ahrefs |
| Backlink growth (new/lost) | Bar chart | Ahrefs or Semrush |
A few notes on pitfalls. Organic sessions in GA4 can drop after a channel grouping update even when traffic is flat — always check the channel definition before calling it a regression. Impressions from Google Search Console and sessions from GA4 will never match exactly; they measure different things (a user can see your result without clicking). Keyword ranking distribution tells a richer story than average position alone: a site moving keywords from positions 11–20 into the top 10 is gaining ground even if average position barely moves.
For each chart, write one sentence of interpretation directly beneath it.
Pro Tip: Show both MoM and YoY comparisons on every core KPI. MoM catches recent shifts; YoY controls for seasonality and prevents false alarms from comparing a slow January to a busy December.
How do you build a monthly SEO report step by step?
The process runs in five stages: collect, validate, visualize, annotate, and deliver. Skipping validation is where most reports go wrong.
- Close the period and freeze the date range. Set your date range to the full calendar month and lock it before pulling any export. Changing it mid-build creates inconsistencies across tools.
- Pull verified exports from each source. Download raw data from Google Search Console (Performance report), GA4 (organic channel segment), your rank tracker (Semrush or Ahrefs position history), and any backlink or technical audit tool. Save the raw files as your appendix.
- Reconcile definitions. Confirm that “organic” in GA4 matches your GSC property. Check for any GA4 channel grouping changes that month. If a tracking tag was added or removed, note it as an annotation.
- Build visuals. Populate your Looker Studio dashboard or slide deck with the KPI table, trendlines, top pages, and technical health summary. Use Looker Studio’s native GSC and GA4 connectors to automate this step going forward.
- Write the executive summary last. After the data is in front of you, write the BLUF paragraph: direction, biggest win or issue, and the decision you need. This is the section stakeholders read first and often only.
- Attach the appendix. Include raw exports, a list of work completed (task, date shipped, metric targeted), and the three next actions with owners and ETAs.
Layout template outline:
- Page 1: BLUF paragraph + 4 KPI stat cards
- Page 2: Trendlines (sessions, impressions, CTR)
- Page 3: Keyword ranking distribution + top pages table
- Page 4: Technical health summary
- Page 5: Work completed + next actions
- Appendix: Raw exports
Google confirmed a core algorithm update on March 5. No manual actions received. Recovery monitoring in progress; next check April 5."
Pro Tip: When a tracking change happens mid-month (a new GA4 tag, a filter update), note the exact date and calculate a partial-month baseline. Comparing a full month against a partial one produces a false MoM swing. Annotate it in the report so no one misreads the delta.
Per Pathfinder SEO’s monthly reporting guide, the discipline of closing the period first, pulling verified exports, and writing the summary last is what keeps month-over-month comparisons valid and the narrative honest.
Which tools should you pull data from?
Most monthly SEO reports draw from five sources: GA4, Google Search Console, a rank tracker, Looker Studio (or another BI tool), and a reporting wrapper like DashThis. Automating exports through connectors reduces manual effort and makes the process repeatable at scale.

Google Analytics 4: Connect via Looker Studio’s native GA4 connector. Export organic channel data segmented by landing page. Watch for channel grouping changes after GA4 updates — they can silently reclassify traffic.
Google Search Console: Use the Performance report for impressions, clicks, CTR, and average position. Export at the page and query level. Note that GSC data has a 2–3 day lag; always pull at least 3 days after month-end.
Semrush or Ahrefs: Pull keyword position history, ranking distribution, and backlink changes. Both tools offer scheduled exports and API access for Looker Studio connectors. Semrush’s Site Audit module covers technical health; Ahrefs’ Site Explorer handles backlinks and organic traffic estimates.
Looker Studio: The default free dashboard builder for most teams. Native connectors for GA4 and GSC make it the lowest-friction option for automation. For agencies managing multiple clients, marketing automation tools can extend Looker Studio with third-party connectors and scheduled delivery.
DashThis: A paid reporting wrapper that pulls from GA4, GSC, and rank trackers into a branded, shareable dashboard. Useful when clients need a polished, always-live view without Looker Studio setup.
Common mismatches to watch:
- GSC impressions vs. GA4 sessions: these will never match. GSC counts every time your URL appeared in search results; GA4 counts sessions that started from a click.
- Timezone differences: GA4 and GSC can be set to different timezones. Align them before comparing daily data.
- AEO/AI visibility: no single standard tool covers this yet. Use server log analysis to identify AI crawler traffic (GPTBot, ClaudeBot, PerplexityBot), manual sampling of AI-generated answers for your key queries, or third-party AI visibility trackers where available.
What report format works best for your audience?
The right format depends on who reads the report and how often they need to act on it. A live dashboard works for daily operations; a slide deck or PDF is better for monthly stakeholder delivery.
| Format | Best For | Update Cadence | Distribution |
|---|---|---|---|
| Looker Studio dashboard | SEO specialists, marketing managers | Real-time or daily | Shared link |
| Slide deck (Google Slides / PowerPoint) | Monthly executive or client review | Monthly | Email or meeting |
| PDF export | Formal client deliverables, archiving | Monthly | Email attachment |
TheStacc’s SEO reporting guide recommends separating audiences by what they care about: executives need a one-page summary with revenue and ROI signals; marketing managers want channel trends; SEO specialists need full technical and ranking detail.
For templates, Looker Studio’s template gallery includes a free SEO dashboard starter you can copy and customize. SEO Report Kit offers an agency-ready monthly template with pre-labeled KPI rows, work-completed sections, and next-action fields. Customize these by updating the date range naming convention (e.g., “March 2026 vs. February 2026 vs. March 2025”), swapping in your client’s brand colors, and confirming that KPI definitions match your GA4 property setup.
A clean file structure for a monthly slide deck: front page with BLUF and KPI cards, trendline slides, top pages and conversions, technical health, work completed, next actions, and a raw-data appendix.
How do you write an executive summary that gets decisions made?
The executive summary rule: one paragraph that states direction (up, down, or flat), names the biggest win or issue, and asks for one specific decision. Everything else in the report supports that paragraph.
Client-facing variant: One technical issue requires attention: 47 pages dropped from the index after a robots.txt change on March 18. We have identified the fix and need your approval to deploy it this week."
CMO/executive variant: The channel is on track to hit Q2 targets. One budget decision needed: expanding the content program by two posts per month would capture an estimated 15 additional ranking opportunities identified in our keyword gap analysis."
Technical lead variant: The LCP regression on the /services/ template from February has been resolved. Three new crawl errors appeared on paginated URLs; these are medium priority and scheduled for the April sprint."
For the scorecard, use 3–4 stat cards: organic sessions (MoM delta), organic conversions (MoM delta), average ranking position (MoM delta), and technical health score. Each card shows the current value, the prior-month value, and the direction arrow.
Recommendation template: Priority (Critical / High / Medium) | Action | Owner | ETA. Three rows maximum per report. More than three and nothing gets done.
What should you check in your monthly technical SEO audit?
The monthly technical checklist catches regressions and validates fixes already shipped. Run it after pulling your rank tracker and GSC data, so you can correlate technical changes to ranking movements.
- Index coverage (Critical): Check GSC’s Index Coverage report for new “Excluded” or “Error” URLs. Report as: “47 pages moved to ‘Excluded’ status this month; root cause: robots.txt update on March 18.”
- Core Web Vitals (Critical): Review GSC’s Core Web Vitals report and Semrush’s Site Audit for LCP, CLS, and INP scores. Report as: “LCP passed on 94% of pages; 3 mobile pages flagged for INP regression.”
- Crawl errors (High): Check for 4xx and 5xx errors in GSC and your crawl tool. Report as: “12 new 404 errors on /blog/ URLs; redirect mapping in progress.”
- Sitemap status (Medium): Confirm the XML sitemap was submitted and processed without errors. Report as: “Sitemap last processed March 31; no errors.”
- Structured data issues (Medium): Check GSC’s Rich Results report for new warnings or errors. Report as: “2 FAQ schema warnings on /faq/ page; fix scheduled for April sprint.”
- Canonical conflicts (Medium): Audit for self-referencing canonicals and cross-domain conflicts using Semrush or Ahrefs. Report as: “No new canonical conflicts detected.”
- Robots.txt and meta robots directives (High): Verify no accidental noindex or disallow changes. Report as: “Robots.txt unchanged from prior month.”
For a plain-English explanation of what these checks mean and why they matter, Proxiumdigital’s technical SEO guide covers the fundamentals without the jargon.
Common mistakes to avoid in monthly SEO reporting
The most common mistake is sending a raw dashboard screenshot with no interpretation. Data without context is noise, not insight.
Do:
- Reconcile data sources before building visuals. If GA4 and GSC numbers look inconsistent, find out why before the client does.
- Define every metric the same way every month. “Organic sessions” means the same channel grouping in January as it does in December.
- Use consistent date ranges. Always compare the same calendar month, not rolling 30-day windows that shift each time.
- Map work completed to the metric it aimed to move. “Published 4 blog posts targeting informational keywords” is more useful than “content work completed.”
- Write the BLUF last, after the data is reconciled.
Don’t:
- Send a Looker Studio link with no commentary and call it a report.
- Mix MoM and YoY comparisons in the same chart without labeling them clearly.
- Report average keyword position as your primary ranking metric. Distribution (how many keywords rank in the top 3, top 10, top 20) tells a more complete story.
- Ignore anomalies. If a metric moved more than 15% in either direction, explain it.
- Include every metric available. A report with 40 KPIs has no priority signal.
Consistency checklist: same KPI definitions, same date range logic, same channel grouping, same property and view, same naming convention for files and slides, and a proof-of-work section that names the task, the date shipped, and the metric it targeted.
How Proxiumdigital builds monthly SEO reports for local service businesses
The key is connecting the data sources before the first report goes out, not retrofitting them later.
Here is the core workflow Proxiumdigital uses for local service clients:
- Data sources: GA4 (organic sessions, goal completions, contact form submissions), Google Search Console (impressions, CTR, top queries), Semrush (local keyword rankings, technical audit), and Google Business Profile insights where applicable
- Automation: Looker Studio with native GA4 and GSC connectors, scheduled to refresh daily; Semrush exports scheduled weekly and pulled into the monthly snapshot
- Who writes the summary: The SEO lead writes the BLUF paragraph after reviewing the data; the account manager reviews it for client-facing language before delivery
- Proof of work: Every report includes a work-completed table: task name, date shipped, and the metric it aimed to move, per the SEO-IO reporting guide
Because Proxiumdigital builds the website and runs the SEO from the same team, the technical baseline is cleaner from day one. There is no handoff between a web developer who does not know the SEO setup and an SEO specialist who cannot touch the site. That integration shows up in the monthly report as fewer technical regressions and faster fix cycles. For a deeper look at Proxiumdigital’s integrated services, the solutions page covers how the web design and SEO work is structured together.
How do you track conversions and revenue in a monthly SEO report?
Conversion and revenue tracking is where monthly SEO reports earn their credibility with executives. Organic sessions are interesting; organic-attributed revenue is what gets budget approved.
Set up GA4 conversion events for every meaningful action: form submissions, phone call clicks, booking completions, and e-commerce purchases. Tag each event with a source/medium dimension so organic traffic is isolated. For service businesses without e-commerce, assign a goal value to form submissions based on average deal size and close rate. That gives you an estimated pipeline figure rather than a raw lead count.
Databox’s SEO reporting guide recommends leading with business outcomes first (conversions and revenue), then visibility and engagement metrics, treating technical issues as supporting context. That order matches how executives read reports.
In the report, show organic conversions with MoM and YoY deltas alongside the conversion rate (organic conversions divided by organic sessions). A rising session count with a falling conversion rate is a signal worth investigating — it often means new traffic is less qualified than the existing base, which points to a keyword targeting or landing page issue.
For local businesses, phone call tracking through a call tracking integration (connected to GA4 via a custom event) closes the loop between search visibility and actual customer contact. Without it, a significant share of organic conversions goes uncounted.
How to incorporate competitor analysis into your monthly report
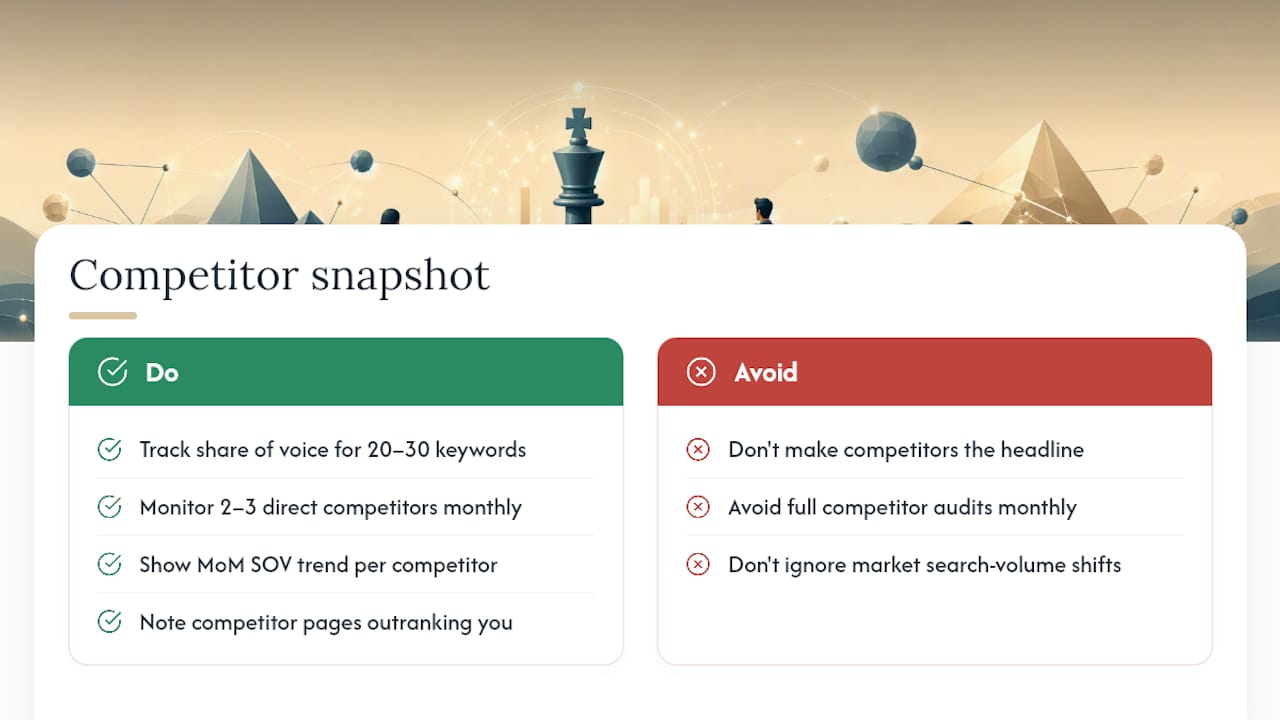
Competitor data belongs in the monthly report as context, not as the headline. The goal is to show whether your organic share is growing or shrinking relative to the market, not to produce a competitor audit every month.
A practical approach is to track share of voice for your 20–30 most important keywords using Semrush or Ahrefs. Share of voice measures what percentage of available clicks your domain captures across that keyword set. A month where your rankings held but share of voice dropped means a competitor gained ground on keywords you both target.
For a deeper framework on competitor benchmarking techniques, the process of identifying which competitors to track and which metrics to prioritize is covered in detail. The short version for monthly reports: pick two or three direct competitors, track their ranking distribution on your target keyword set, and note any content they published that is now outranking yours.
In the report itself, a one-slide competitor snapshot works well: your share of voice vs. two competitors, MoM trend, and one observation (“Competitor A published a service comparison page in March that now ranks #4 for [keyword]; recommend a response piece in April”). Keep it brief. Executives do not need a full competitive audit every month; they need to know if the competitive position is improving or eroding.
Market trends belong in the same section. If search volume for your core service terms shifted materially (a seasonal spike, a news event, a Google Trends movement), note it as context for traffic changes. It prevents a seasonal traffic dip from being misread as a strategy failure.
What monthly reporting actually gets right — and what most teams miss
Most monthly SEO reports fail not because of bad data but because of bad sequencing. Teams pull the numbers, drop them into a slide, and send it. The BLUF gets written first, before the data is reconciled, which means it is often wrong by the time the report goes out.
The reports that actually change decisions share one trait: the person writing the summary has read the data before writing a single word of interpretation. That sounds obvious. In practice, most reports are assembled under time pressure, and the summary is written from memory or from last month’s template with the numbers swapped in.
Automation is the fix for the time pressure, not the summary. Automate the data pulls, the connector refreshes, and the visualization updates. That frees the analyst to spend their time on the one thing automation cannot do: read the chart, understand what changed, and write one honest paragraph about it. SE Ranking’s reporting guide makes this point directly: automate exports and visualizations, but keep a human review step for annotations and decisions.
The other thing most teams miss is the proof-of-work section. For in-house teams, it builds institutional memory. For agencies, it is the single most effective churn-reduction tool in the report. Clients who can see exactly what was done, when, and what it moved are far less likely to question the value of the retainer. Name the task, the date it shipped, and the metric it aimed to move. Three rows, every month, without fail.
Proxiumdigital handles the reporting so your team can focus on strategy
Running a monthly SEO report well takes about four to six hours per client when the data sources are connected and the template is set. Most teams do not have that time, or they have the time but not the tooling.

Proxiumdigital’s SEO optimization services include monthly performance reporting built into every retainer. That means GA4 and GSC connectors configured from day one, a Looker Studio dashboard refreshed automatically, and a written BLUF delivered to your inbox each month with work completed and three prioritized next actions. For local service businesses in Michigan, the reporting is tuned to the metrics that matter for local search: organic bookings, call click-throughs, map pack visibility, and local keyword rankings.
If you want to see what a report looks like before committing, Proxiumdigital offers a sample report review as part of its onboarding conversation. You can review service options and pricing or reach out directly to schedule a walkthrough.
Sources
- SEO Monthly Report Template With KPI Notes for Agencies
- SE Ranking — SEO reports for clients
- SEO-IO — SEO reporting guide
FAQ
What should an SEO monthly report include?
A monthly SEO report should include a BLUF executive summary, 6–8 KPIs with MoM and YoY comparisons (organic sessions, impressions/CTR, ranking distribution, conversions, technical health), a top-pages table, a work-completed section, and three prioritized next actions with named owners.
How do you build a monthly SEO report?
Close the date range, pull verified exports from GA4, Google Search Console, and your rank tracker, reconcile definitions, build visuals in Looker Studio, then write the executive summary last after the data is in front of you.
How often should you send an SEO report?
Monthly is the standard cadence for most engagements. New campaigns benefit from bi-weekly check-ins, while enterprise accounts often use weekly summaries paired with a monthly deep dive.
What does a good SEO report look like?
A one-page BLUF with KPI stat cards, trendlines, a top-pages table, a technical health summary, a work-completed list, and three next actions. Executives should be able to read it in under three minutes and know exactly what to decide.